BALTIMORE (Stockpickr) -- Tech stocks are back in a big way this summer. After correcting hard in the second quarter of this year, the technology sector has climbed 8.9% higher since the start of May. That's nearly double the performance of the rest of the S&P 500.
Read More: 5 Breakout Stocks Under $10 Set to Soar
But don't worry if you've missed the move in tech. With the broad market hitting new highs this week, the rally looks far from over. And technology stocks look likely to keep leading as we head into September.
Of course, that doesn't mean that all technology stocks are going to do well in the month ahead.
That's why, to weed out the best-positioned names, we're turning to the charts for a technical look at five big tech names to trade for gains this week.
For the unfamiliar, technical analysis is a way for investors to quantify qualitative factors, such as investor psychology, based on a stock's price action and trends. Once the domain of cloistered trading teams on Wall Street, technicals can help top traders make consistently profitable trades and can aid fundamental investors in better planning their stock execution.
Without further ado, let's take a look at five technical setups worth trading now.
Read More: Warren Buffett's Top 10 Dividend Stocks
Salesforce.com
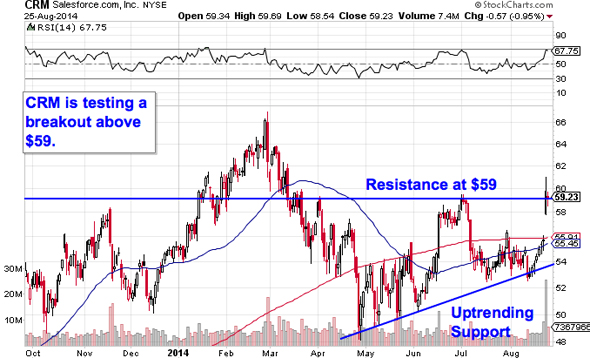
Up first is Salesforce.com (CRM), a name that's up big in the last week on the heels of strong earnings numbers. It's about time too. Salesforce's shares have seen extremely chopping trading in 2014, peaking back at the end of February and treading water ever since. But CRM could be making a second attempt at highs in the month ahead. Here's why.
CRM is currently forming an ascending triangle bottom, a bullish price pattern that's formed by horizontal resistance above shares (in this case at $59) and uptrending support to the downside. Basically, as CRM bounces in between those two technically important levels, it's getting squeezed closer to a breakout above that $59 price ceiling. In fact, shares are testing that level this week. When the breakout gets confirmed by a material close above $59, then we've got our buy signal.
After that, CRM's previous all-time high at $66 looks like the next target on buyers' radar. For risk averse traders, consider scaling out up closer to $66 to take the 10% gain. Otherwise, a secondary breakout above that $66 level means that even higher ground looks likely.
For more on Salesforce, check out "Why Salesforce Remains a Steal at Under $65."
Read More: 10 Stocks George Soros Is Buying
Akamai Technologies
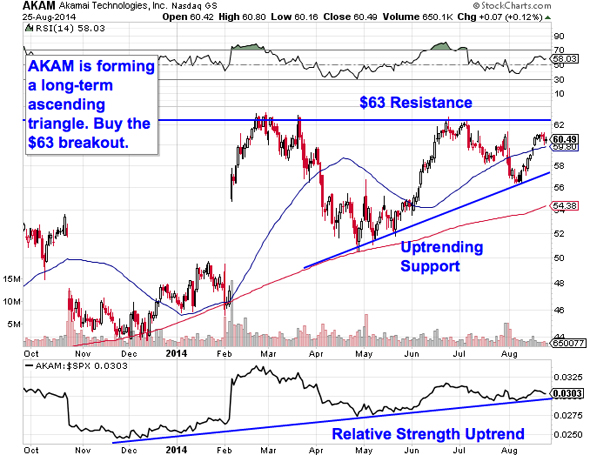
We're seeing the exact same setup in shares of Akamai Technologies (AKAM) right now. The big difference is the fact that AKAM's trade looks a lot more textbook than the one in CRM. The breakout level to watch in this $11 billion content delivery company comes up at $63 resistance.
If shares can break out above that $63 level, then it's time to be a buyer.
Why all of that significance at $63? It all comes down to buyers and sellers. Price patterns are a good quick way to identify what's going on in the price action, but they're not the actual reason a stock is tradable. Instead, the "why" comes down to basic supply and demand for Akamai's stock.
The $63 resistance level is a price where there has been an excess of supply of shares; in other words, it's a spot where sellers have previously been more eager to step in and take gains than buyers have been to buy. That's what makes a breakout above $63 so significant -- the move means that buyers are finally strong enough to absorb all of the excess supply above that price level.
The side-indicator to watch in shares of Akamai is relative strength. AKAM's relative strength line has kept its uptrend intact since last December, a fact that means that this stock isn't just moving higher. It's also outperforming the S&P 500 along the way. As long as relative strength keeps making higher lows, this stock should keep beating the rest of the market.
Read More: 7 Stocks Warren Buffett Is Selling in 2014
Texas Instruments
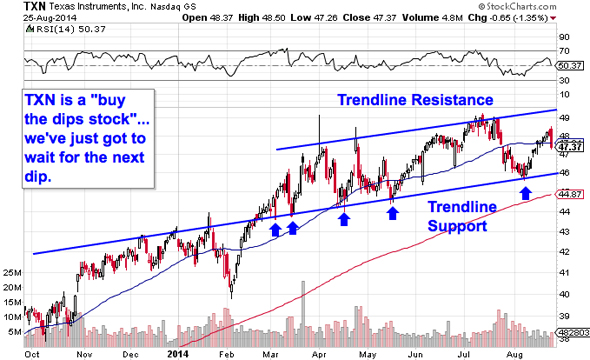
Things look a lot simpler in shares of $51 billion chipmaker Texas Instruments (TXN). You don't need to be some kind of trading expert to figure out what's going on in this name -- a quick glimpse at the chart should tell you pretty much everything you need to know. TXN's price action is moving up and to the right, and that's a good thing.
Put another way, Texas Instruments is bouncing its way higher in a textbook uptrending channel, a price pattern that's formed by a pair of parallel trend lines that identify the high-probability range for shares to stay within. Every correction down to trend line support has given investors an optimal entry opportunity for buying shares, so that means that patience is a virtue in shares of TXN right now; it makes sense to wait for the next bounce before buying.
Waiting for a bounce is important for two key reasons: It's the spot where shares have the furthest to move up before they hit resistance, and it's the spot where the risk is the least (because shares have the least room to move lower before you know you're wrong). Remember, all trend lines do eventually break, but by actually waiting for the bounce to happen first, you're ensuring TXN can actually still catch a bid along that line before you put your money on shares.
Read More: 10 Stocks Carl Icahn Loves in 2014
Nokia
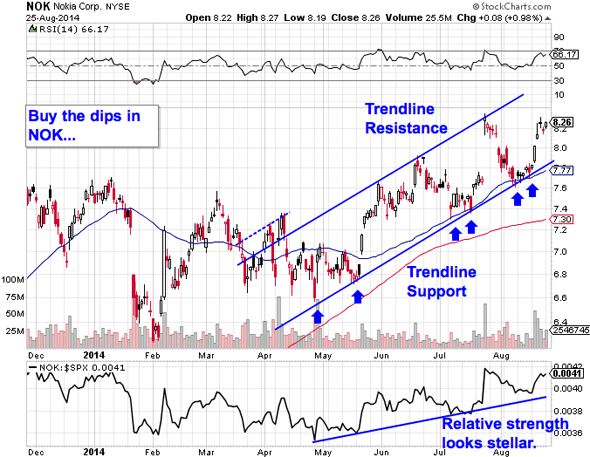
Finnish phone network company Nokia (NOK) is another "buy the dips" tech stock that's on our radar this week. Like Texas Instruments, Nokia established an uptrend earlier this year, bouncing its way higher on every successive test of trend line support. So, from here, it makes sense to wait a few sessions for another bounce before building a position in NOK.
The 50-day moving average has been a nearly perfect proxy for support on the way up in NOK, which makes it a logical place to keep a protective stop. If shares violate the 50-day, then you don't want to own this name anymore.
Don't get thrown off by the abundance of gaps on Nokia's chart right now. Those gaps, called suspension gaps, are caused by overnight trading on the Helsinki Stock Exchange. They can be ignored for trading purposes.
Read More: These 5 Stocks Could Be Poisoning Your Portfolio
3D Systems
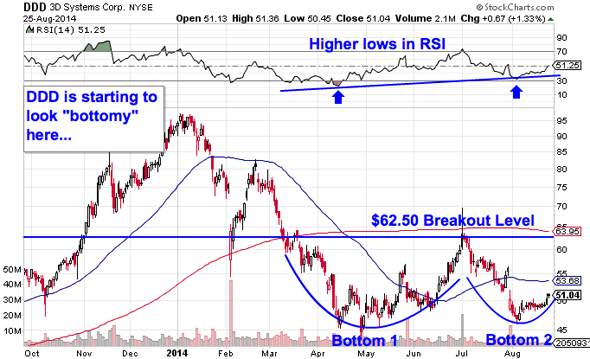
Last up is 3D printing stock 3D Systems (DDD), a name that's caught plenty of attention as one of the rare pure-play names in a niche that's become hot in the last couple of years. While 3D printing has been attracting buyers, shares of DDD haven't been -- this stock is down more than 45% since the calendar flipped to January. But that could be about to change thanks to a bullish reversal setup that's been forming in shares for the last few months.
DDD is currently forming a double bottom, a bullish price pattern that looks just like it sounds: The double bottom is formed by a pair of swing lows that bottom out at approximately the same price level. The buy signal comes on a push through the resistance level that separates those two lows. For DDD, that breakout level to watch is $62.50.
Momentum adds some extra confidence in 3D Systems' upside potential right now: 14-day RSI has been making higher lows, even as its share price re-tested support at $45. That's a good indication that buyers have been getting more aggressive in this stock in August. When DDD can catch a bid above $62.50 again, it's a buy.
-- Written by Jonas Elmerraji in Baltimore.
RELATED LINKS:
>>4 Stocks Breaking Out on Big Volume
>>5 Hated Earnings Stocks You Should Love
>>Must-See Charts: Still Time to Buy These 5 Stocks
Follow Stockpickr on Twitter and become a fan on Facebook.
At the time of publication, author had no positions in stocks mentioned.
Jonas Elmerraji, CMT, is a senior market analyst at Agora Financial in Baltimore and a contributor to
TheStreet. Before that, he managed a portfolio of stocks for an investment advisory returned 15% in 2008. He has been featured in Forbes , Investor's Business Daily, and on CNBC.com. Jonas holds a degree in financial economics from UMBC and the Chartered Market Technician designation.Follow Jonas on Twitter @JonasElmerraji
No comments:
Post a Comment