BALTIMORE (Stockpickr) -- The big indices gave back nearly a full percentage point each on average yesterday, reminding investors that the sideways churn isn't over yet. Just when the broad market was grasping at new highs, it got swatted lower in a move much like the one back at the start of April.
>>5 Big Stocks to Trade for Gains This Summer
That prolonged sideways price action is frustrating, but it's not particularly ominous -- unless you own some toxic names in your portfolio. Frankly, the biggest gains this year haven't come from picking the right stocks; they've come from not owning the wrong ones.
Today, we're taking a closer look at five large-cap names that look toxic in May.
Just to be clear, the companies I'm talking about today aren't exactly junk. By that, I mean they're not next up in line at bankruptcy court. But that's frankly irrelevant; from a technical analysis standpoint, sellers are shoving around these toxic stocks right now. For that reason, fundamental investors need to decide how long they're willing to take the pain if they want to hold onto these firms in the weeks and months ahead. And for investors looking to buy one of these positions, it makes sense to wait for more favorable technical conditions (and a lower share price) before piling in.
>>5 Stocks Insiders Love Right Now
For the unfamiliar, technical analysis is a way for investors to quantify qualitative factors, such as investor psychology, based on a stock's price action and trends. Once the domain of cloistered trading teams on Wall Street, technicals can help top traders make consistently profitable trades and can aid fundamental investors in better planning their stock execution.
So without further ado, let's take a look at five toxic stocks you should be unloading.
PowerShares QQQ Trust
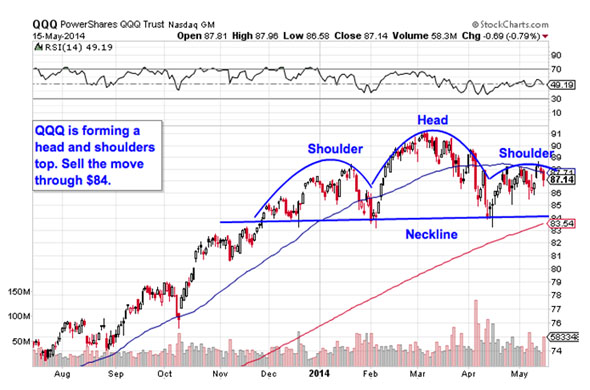
First up is "The Qs": the PowerShares QQQ Teust (QQQ), a $40 billion ETF that tracks the performance of the Nasdaq 100 Index. QQQ has been a popular trading vehicle for the last couple of years, primarily because it's tracked the Nasdaq's performance during a span where high-momentum tech names have worked really well. But since March, the opposite has been true, and this ETF has corrected to the tune of 5%.
Materially lower ground could be in the cards now, thanks to a classical bearish setup in shares. Here's what to look out for.
QQQ is currently forming a textbook head and shoulders top, a bearish reversal pattern that indicates exhaustion among buyers. The setup is formed by two swing highs that top out at approximately the same level (the shoulders), separated by a higher high (the head). The sell signal comes on a move through QQQ's neckline, which is right at $84. Put more simply, if QQQ can't catch a bid above $84, it becomes a sell.
It's important to remember that this stock's setup is conditional. It doesn't become toxic until that $84 neckline gets violated. In the meantime, this big index ETF has ample opportunities to change its course. That said, investors should at least be keeping a close eye on that $84 level in May. If shares break down though it, look out below.
Fluor
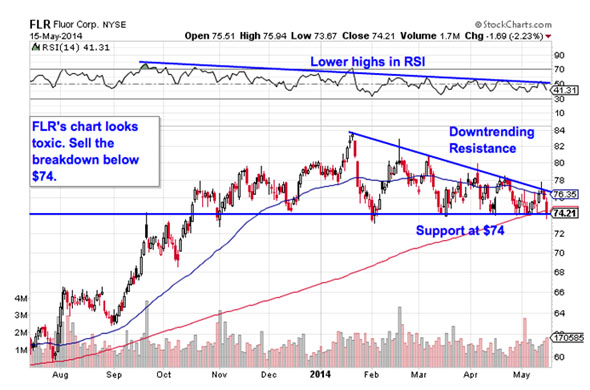
$12 billion engineering services firm Fluor (FLR) is another name that's looking toxic in May. In fact, shares have been forming a bearish price setup since all the way back in January, making it a longer-term trade with equally long-term trading implications when it triggers. That means FLR could be in store for a pretty rough summer.
Fluor is currently forming a descending triangle setup, a bearish trade that's formed by horizontal support below shares (in this case at $74), and downtrending resistance to the topside. Basically, as FLR bounces in between those two technically-significant price levels, it's getting squeezed closer and closer to a breakdown below that $74 price floor. When that happens, it's time to be a seller.
Momentum, measured by 14-day RSI, adds some extra evidence to Fluor's downside setup. Our momentum gauge has been making lower highs going all the way back to last September. Since momentum is a leading indicator of price, that doesn't bode well for FLR's longs right now.
FedEx
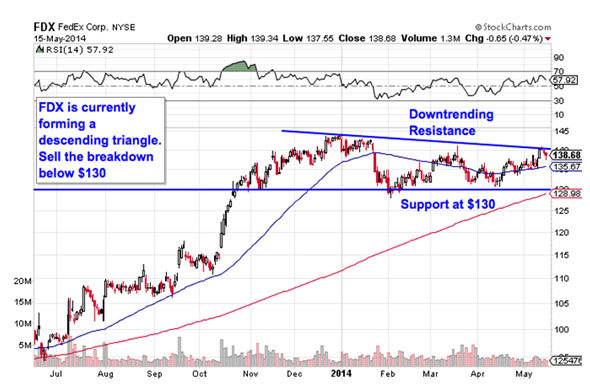
We're seeing the exact same setup in shares of FedEx (FDX). After rallying more than 38% amid strength in the transports sector, a descending triangle is indicating that FDX might be getting ready to roll over. The support level to watch is $130 – if FedEx breaks down below it, it's time to sell the shipping giant.
Why the significance at $130? Whenever you're looking at any technical price pattern, it's critical to keep buyers and sellers in mind. Patterns like head and shoulders setups and descending triangles are a good way to quickly describe what's going on in a stock, but they're not the reason it's tradable. Instead, it all comes down to supply and demand for shares.
That horizontal $130 support level in FDX is the spot where there's previously been an excess of demand for shares; in other words, it's a price where buyers have been more eager to step in and buy shares at a lower price than sellers were to sell. That's what makes a breakdown below support so significant -- the move means that sellers are finally strong enough to absorb all of the excess demand at the at price level.
For the best risk/reward tradeoff, wait for the next move lower before selling FDX.
Agilent Technologies
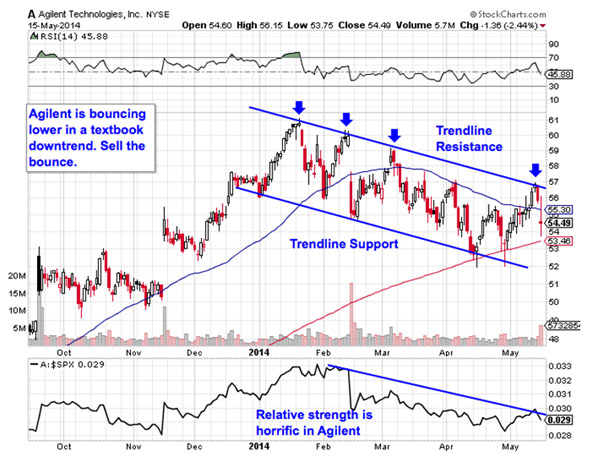
You don't have to be an expert technical trader to figure out what's going on in shares of measurement equipment manufacturer Agilent Technologies (A); this chart is about as simple as they get. Agilent is currently forming a textbook downtrending channel, and that makes this a toxic name in May.
The setup is formed by a pair of parallel trend lines: a resistance line above shares, and a support line below them. Those two lines on the chart provide traders with the high-probability range for Agilent's shares to stay within. When it comes to trend channels, up is good and down is bad; it's really as simple as that. And with shares moving lower off of trend line resistance for a fourth time since January, now's the time to sell this toxic stock.
Another indicator, relative strength (not to be confused with RSI), is the side signal that's pointing to downside in Agilent in May. Relative strength has been trending lower since February, indicating that this $18 billion stock is continually underperforming the broad market this year.
Walgreen
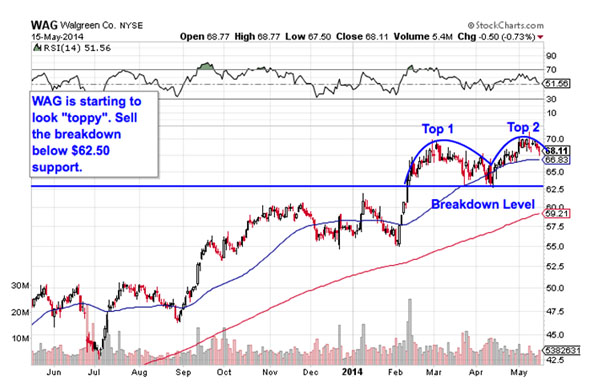
Last up is Walgreen (WAG), a name that's shown investors some outstanding performance this past year. In the trailing 12 months, Walgreen has rallied more than 39%, outperforming the S&P 500 by more than double. But after climbing higher for so long, WAG is starting to look "toppy" this month. Here's how to trade it.
Walgreen is currently forming a double top setup, a bearish reversal pattern that looks just like it sounds. The double top is formed by a pair of swing highs that max out at approximately the same price level. The sell signal comes when the trough that separates the two highs gets violated. For WAG, that breakdown level is right at $62.50, a price level that shares are moving back down toward this week.
Like the other conditional trades on this list, until the breakdown below $62.50 happens, downside isn't a high probability trade -- yet. When and if $62.50 gets taken out, though, you'll want to be a seller. If you decide to short WAG on the break, keep a protective stop at the 50-day moving average.
To see this week's trades in action, check out the Toxic Stocks portfolio on Stockpickr.
-- Written by Jonas Elmerraji in Baltimore.
RELATED LINKS:
>>3 Stocks Breaking Out on Big Volume
>>5 Rocket Stocks to Beat a Sideways Market
>>5 Tech Stocks Entering Breakout Mode
Follow Stockpickr on Twitter and become a fan on Facebook.
At the time of publication, author had no positions in stocks mentioned.
Jonas Elmerraji, CMT, is a senior market analyst at Agora Financial in Baltimore and a contributor to
TheStreet. Before that, he managed a portfolio of stocks for an investment advisory returned 15% in 2008. He has been featured in Forbes , Investor's Business Daily, and on CNBC.com. Jonas holds a degree in financial economics from UMBC and the Chartered Market Technician designation.Follow Jonas on Twitter @JonasElmerraji
No comments:
Post a Comment