DELAFIELD, Wis. (Stockpickr) -- Trading stocks that trigger major breakouts can lead to massive profits. Once a stock trends to a new high, or takes out a prior overhead resistance point, then it's free to find new buyers and momentum players that can ultimately push the stock significantly higher.
One example of a successful breakout trade I flagged recently was development-stage biopharmaceutical player Biodel (BIOD), which I featured in July 18's "5 Stocks Under $10 Set to Soar" at around $4.60 a share. I mentioned in that piece that shares of BIOD had been trending sideways, with the stock moving between $3.93 on the downside and $5.11 on the upside. The stock was just starting to break out above some near-term overhead resistance at $4.46 a share, and it was quickly moving within range of triggering a major breakout trade above the upper-end of its recent range at $4.46 to $5.11 a share.
Guess what happened? Shares of BIOD didn't wait long to trigger that move, since the stock started to break out on July 29 with heavy upside volume. After shares of BIOD cleared resistance at $4.46 to $5.11 a share with strong volume, then the stock quickly tagged its recent 52.week high at $6.08 a share. That represents a gain of just over 30% for anyone who loaded up on BIOD once it triggered that technical breakout. You can see here how powerful trading breakouts can be, and the key is always to follow price and volume.
Breakout candidates are something that I tweet about on a daily basis. I frequently tweet out high-probability setups, breakout plays and stocks that are acting technically bullish. These are the stocks that often go on to make monster moves to the upside. What's great about breakout trading is that you focus on trend, price and volume. You don't have to concern yourself with anything else. The charts do all the talking.
Trading breakouts is not a new game on Wall Street. This strategy has been mastered by legendary traders such as William O'Neal, Stan Weinstein and Nicolas Darvas. These pros know that once a stock starts to break out above past resistance levels, and hold above those breakout prices, then it can easily trend significantly higher.
With that in mind, here's a look at five stocks that are setting up to break out and trade higher from current levels.
Trulia
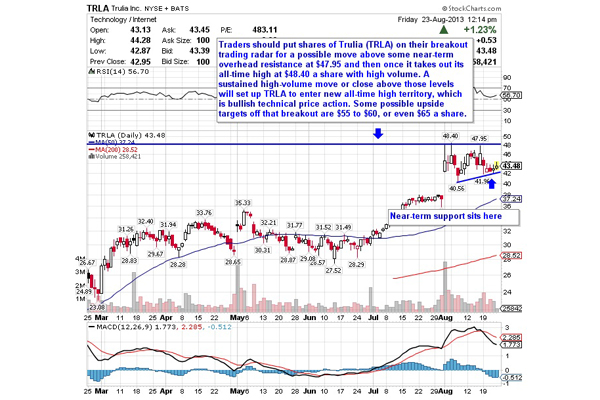
One stock that's starting to move within range of triggering a near-term breakout trade is Trulia (TRLA), which operates as a real estate search engine. This stock has been red hot so far in 2013, with shares up sharply by 167%.
If you take a look at the chart for Trulia, you'll notice that this stock has been trending sideways and consolidating gains for the last month, after it gapped up sharply from $36 to $48 with heavy upside volume. That sideways trend has shares of TRLA moving between $40.56 on the downside and $48.40 on the upside. Shares of TRLA are now starting to bounce off some near-term support at $42 a share, and it's quickly moving within range of triggering a major breakout trade above the upper-end of its recent range.
Traders should now look for long-biased trades in TRLA if it manages to break out above some near-term overhead resistance at $47.95 and then once it takes out its all-time high at $48.40 a share with high volume. Look for a sustained move or close above those levels with volume that hits near or above its three-month average action of 679,352 shares. If that breakout hits soon, then TRLA will set up to enter new all-time high territory, which is bullish technical price action. Some possible upside targets off that breakout are $55 to $60, or even $65 a share.
Traders can look to buy TRLA off any weakness to anticipate that breakout and simply use a stop that sits right below some key near-term support levels at $41.96 or $40.56 a share. One could also buy TRLA off strength once it takes out those breakout levels with volume and then simply use a stop that sits a comfortable percentage from your entry point.
Uni-Pixel
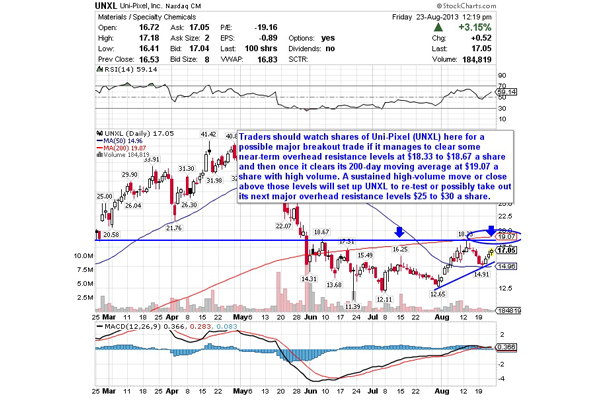
Another stock that looks poised for a major breakout trade is Uni-Pixel (UNXL), which manufactures electronic film products using its proprietary manufacturing process, UniBoss, and delivers its products to the display, touch screen and flexible electronics market segments. This stock is off to a decent start so far in 2013, with shares up 23%.
If you take a look at the chart for Uni-Pixel, you'll notice that this stock has been uptrending for the last two months, with shares moving higher from its low of $11.39 to its recent high of $18.33 a share. During that uptrend, shares of UNXL have been making mostly higher lows and higher highs, which is bullish technical price action. Shares of UNXL recently pulled right back to its 50-day moving average at $14.91 a share, and the stock has now started to bounce strongly off that level and move within range of triggering a major breakout trade.
Traders should now look for long-biased trades in UNXL if it manages to break out above some near-term overhead resistance levels at $18.33 to $18.67 a share and then once it clears its 200-day moving average at $19.07 a share with high volume. Look for a sustained move or close above those levels with volume that hits near or above its three-month average action 1.27 million shares. If that breakout triggers soon, then UNXL will set up to re-test or possibly take out its next major overhead resistance levels $25 to $30 a share.
Traders can look to buy UNXL off any weakness to anticipate that breakout and simply use a stop that sits right below its 50-day at $14.91 a share. One could also buy UNXL off strength once it takes out those breakout levels with volume and then simply use a stop that sits a comfortable percentage from your entry point.
Noodles
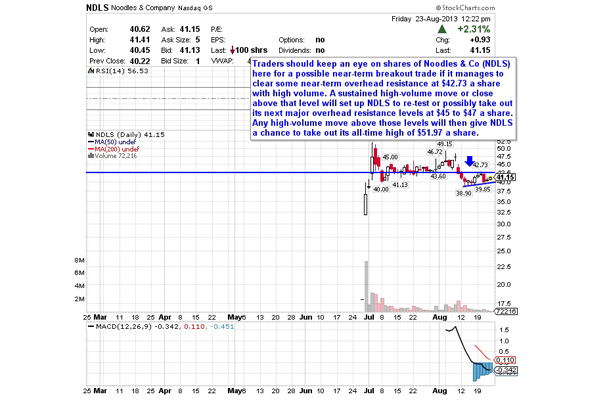
Another stock that's starting to move within range of triggering a near-term breakout trade is Noodles (NDLS), which develops and operates fast casual restaurants that serves noodle and pasta dishes, soups, salads and sandwiches. This stock is off to a decent start so far in 2013, with shares up 12.2%.
If you look at the chart for Noodles, you'll notice that this stock recently pulled back from $49.15 to $38.90 a share. During that pullback, shares of NDLS were marking lower highs and lower lows, which is bearish technical price action. That said, shares of NDLS have now started to stabilize below $39 a share and the stock is starting to form a near-term uptrend. That uptrend is quickly pushing NDLS within range of triggering a near-term breakout trade.
Traders should now look for long-biased trades in NDLS if it manages to break out above some near-term overhead resistance at $42.73 a share with high volume. Look for a sustained move or close above that level with volume that hits near or above its three-month average action of 923,754 shares. If that breakout triggers soon, then NDLS will set up to re-test or possibly take out its next major overhead resistance levels at $45 to $47 a share. Any high-volume move above those levels will then give NDLS a chance to take out its all-time high of $51.97 a share.
Traders can look to buy NDLS off any weakness to anticipate that breakout and simply use a stop that sits right below some key near-term support levels at $39.85 or $38.90 a share. One can also buy NDLS off strength once it takes out $42.73 with volume and then simply use a stop that sits a comfortable percentage from your entry point.
Market Vectors Gold Miners ETF
Top 10 Value Stocks To Watch Right Now
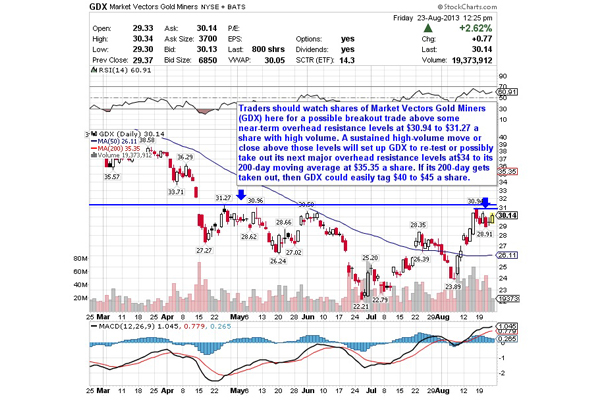
Another stock that's quickly moving within range of triggering a near-term breakout trade is Market Vectors Gold Miners ETF (GDX), which seeks to replicate as closely as possible the price and yield performance of NYSE Arca Gold Miners Index. This ETF has been hit hard by the bears so far in 2013, with shares off by 34.9%.
If you look at the chart for Market Vectors Gold Miners ETF, you'll notice that this ETF has been uptrending for the last two months, with shares moving higher from its low of $22.21 to its recent high of $30.94 a share. During that uptrend, shares of GDX have been making mostly higher lows and higher highs, which is bullish technical price action. That move is quickly pushing shares of GDX within range of triggering a near-term breakout trade.
Traders should now look for long-biased trades in GDX if it manages to break out above some near-term overhead resistance levels at $30.94 to $31.27 a share with high volume. Look for a sustained move or close above those levels with volume that hits near or above its three-month average action of 31.39 million shares. If that breakout triggers soon, then GDX will set up to re-test or possibly take out its next major overhead resistance levels at$34 to its 200-day moving average at $35.35 a share. If its 200-day gets taken out, then GDX could easily tag $40 to $45 a share.
Traders can look to buy GDX off any weakness to anticipate that breakout and simply use a stop that sits right below some near-term support at $28.91 a share, or below $27 a share. One can also buy GDX off strength once it takes out those breakout levels with volume and then simply use a stop that sits a comfortable percentage from your entry point.
Allied Nevada Gold
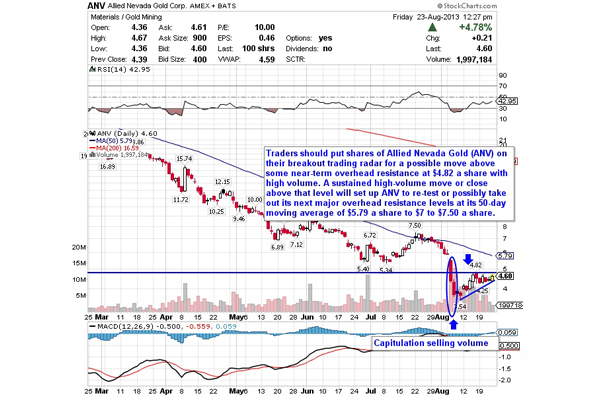
My final breakout trading prospect is Allied Nevada Gold (ANV), a gold mining company. This stock has been destroyed by the bears so far in 2013, with shares off sharply by 84%.
If you look at the chart for Allied Nevada Gold, you'll notice that this stock has been downtrending badly for the last six months, with shares plunging lower from over $20 to its recent low of $3.54 a share. During that downtrend, shares of ANV have been consistently making lower highs and lower lows, which is bearish technical price action. That said, shares of ANV recently saw some higher volume capitulation selling down to that $3.54 low. That could be marking a low for the stock, and shares have now started to uptrend in the near-term from $3.54 to its recent high of $4.82 a share. That rebound is starting to push shares of ANV within range of triggering a major breakout trade.
Traders should now look for long-biased trades in ANV if it manages to break out above some near-term overhead resistance at $4.82 a share with high volume. Look for a sustained move or close above that level with volume that hits near or above its three-month average action of 4.02 million shares. If that breakout triggers soon, then ANV will set up to re-test or possibly take out its next major overhead resistance levels at its 50-day moving average of $5.79 a share to $7 to $7.50 a share.
Traders can look to buy ANV off any weakness to anticipate that breakout and simply use a stop that sits right below some key near-term support levels at $4.25 or that recent low of $3.54 a share. One could also buy ANV off strength once it clears that breakout level with volume and then simply use a stop that sits a conformable percentage from your entry point.
To see more breakout candidates, check out the Breakout Stocks of the Week portfolio on Stockpickr.
-- Written by Roberto Pedone in Delafield, Wis.
No comments:
Post a Comment